Financial Highlights
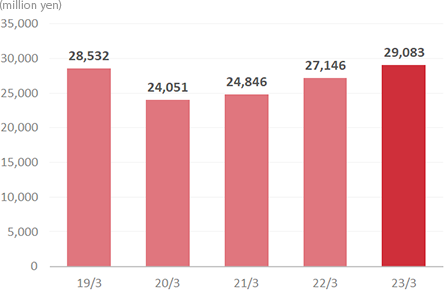
Total assets
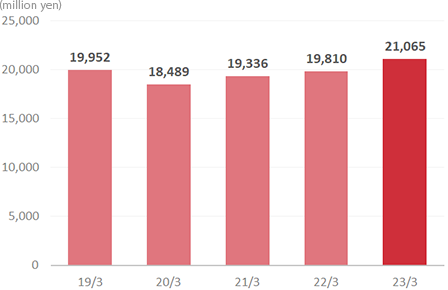
Net assets
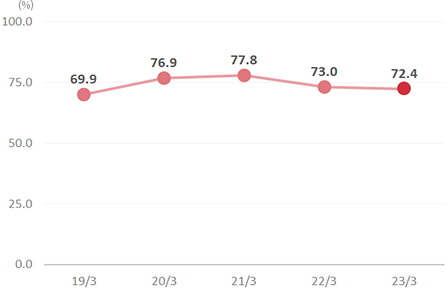
Equity ratio
Net assets per share
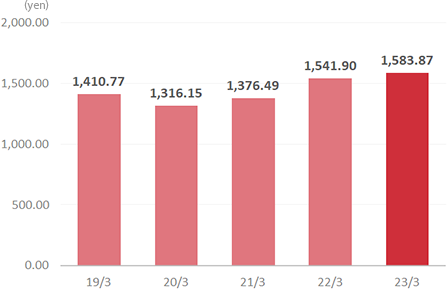
| Year 2019 March term |
Year 2020 March term |
Year 2021 March term |
Year 2022 March term |
Year 2023 March term |
|
|---|---|---|---|---|---|
| Number of shares issued at the end of period (including treasury stock) | 14,950,000 | 14,950,000 | 14,950,000 | 14,950,000 | 14,950,000 |
| Number of treasury stock at year-end | 807,120 | 902,122 | 902,122 | 2,102,122 | 1,650,022 |
Notes
- The contents of this page may not immediately reflect the corrections of the brief financial statements.
- Even if there is a stock split, etc. the related indicators will not be retroactively adjusted.
- The frequency of updates may change due to changes in the financial statements format.
These data are prepared based on the financial report.
Although we take great care in converting the data for publication, please be aware that there is a possibility that information may be erroneous due to mechanical defects, tampering by a third party or malfunction of machinery etc.
For more information on financial results, please refer to the financial summary.
